How Can We Help?
Trucky Dashboard Designer, Viewer and Mobile App
What is Trucky Dashboard?
Trucky Dashboard is a new feature, written entirely from scratch, a sort of “app within an app” that allows you to design interactive and incredibly dynamic dashboards and use them on your computer, on another computer, and of course on mobile devices such as smartphones and tablets, both Android and Apple.
The Designer appears as a WYSIWYG (What you see is what you get) graphic editor in which you can design components one by one, using dozens and dozens of options available for their highly dynamic configuration.
Visit the Dashboard Gallery for pre-made and community designs
Some components can be linked to Telemetry values to make them react to changes in the game.
Components such as Gauge and Progress Bar contain “Telemetry Bindings” for minimum, maximum, and current values; the Label can be static or linked to Telemetry, and can disappear if not valued; Image components can be linked to one or more states, such as ON/OFF.
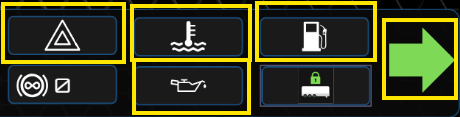
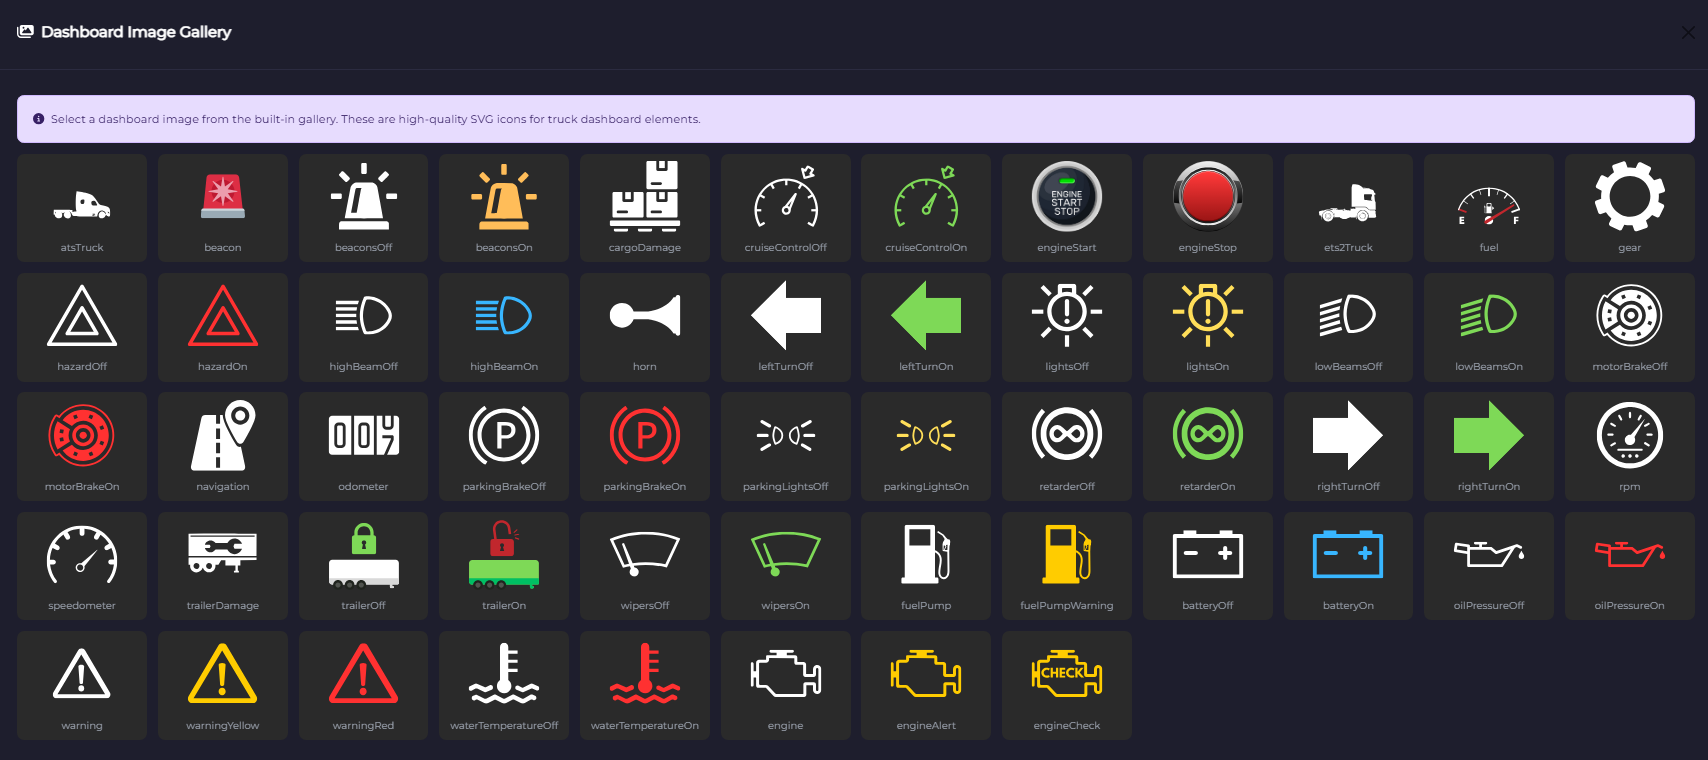
The Dashboard Designer already includes more than 50 high-quality SVG images for the most common icons used in a Dashboard.
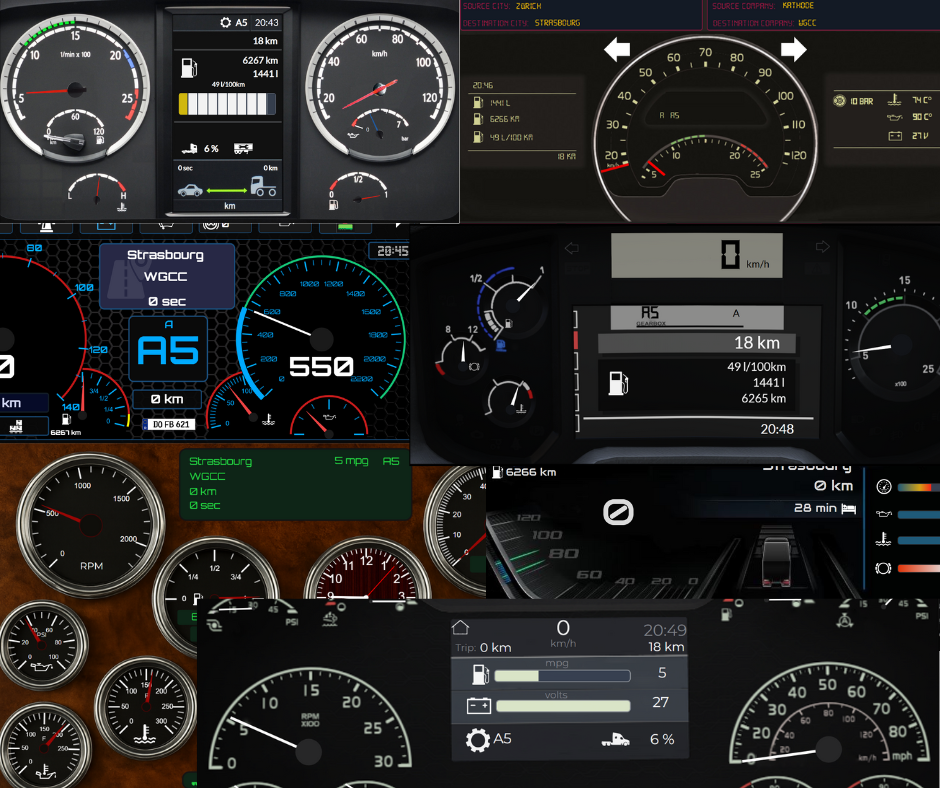
Together with high-quality backgrounds from existing or custom-designed dashboards, you can create faithful reproductions of real or in-game truck dashboards.
The Dashboard Designer is a Freemium feature, components number is limited based on your Trucky Subscription:
- Free for everyone: 5 components
- Fan Patrons: 20 components ⭐
- Angel Patrons: Unlimited components ⭐
Dashboard Designer
How to open the Dashboard Designer
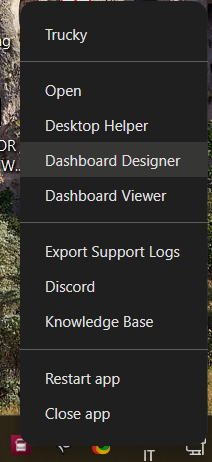
From the Trucky tray icon > right click > Dashboard Designer
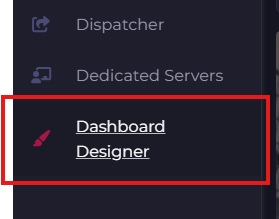
or from the main Desktop Window
⭐Components Limits
The Dashboard Designer is a Freemium feature, components number is limited based on your Trucky Subscription:
- Free for everyone: 5 components
- Fan Patrons: 20 components ⭐
- Angel Patrons: Unlimited components ⭐
Dashboard Designer Areas
The Dashboard Designer is a pretty complete but complete window that will permit you to design beautiful and stunning dashboards.
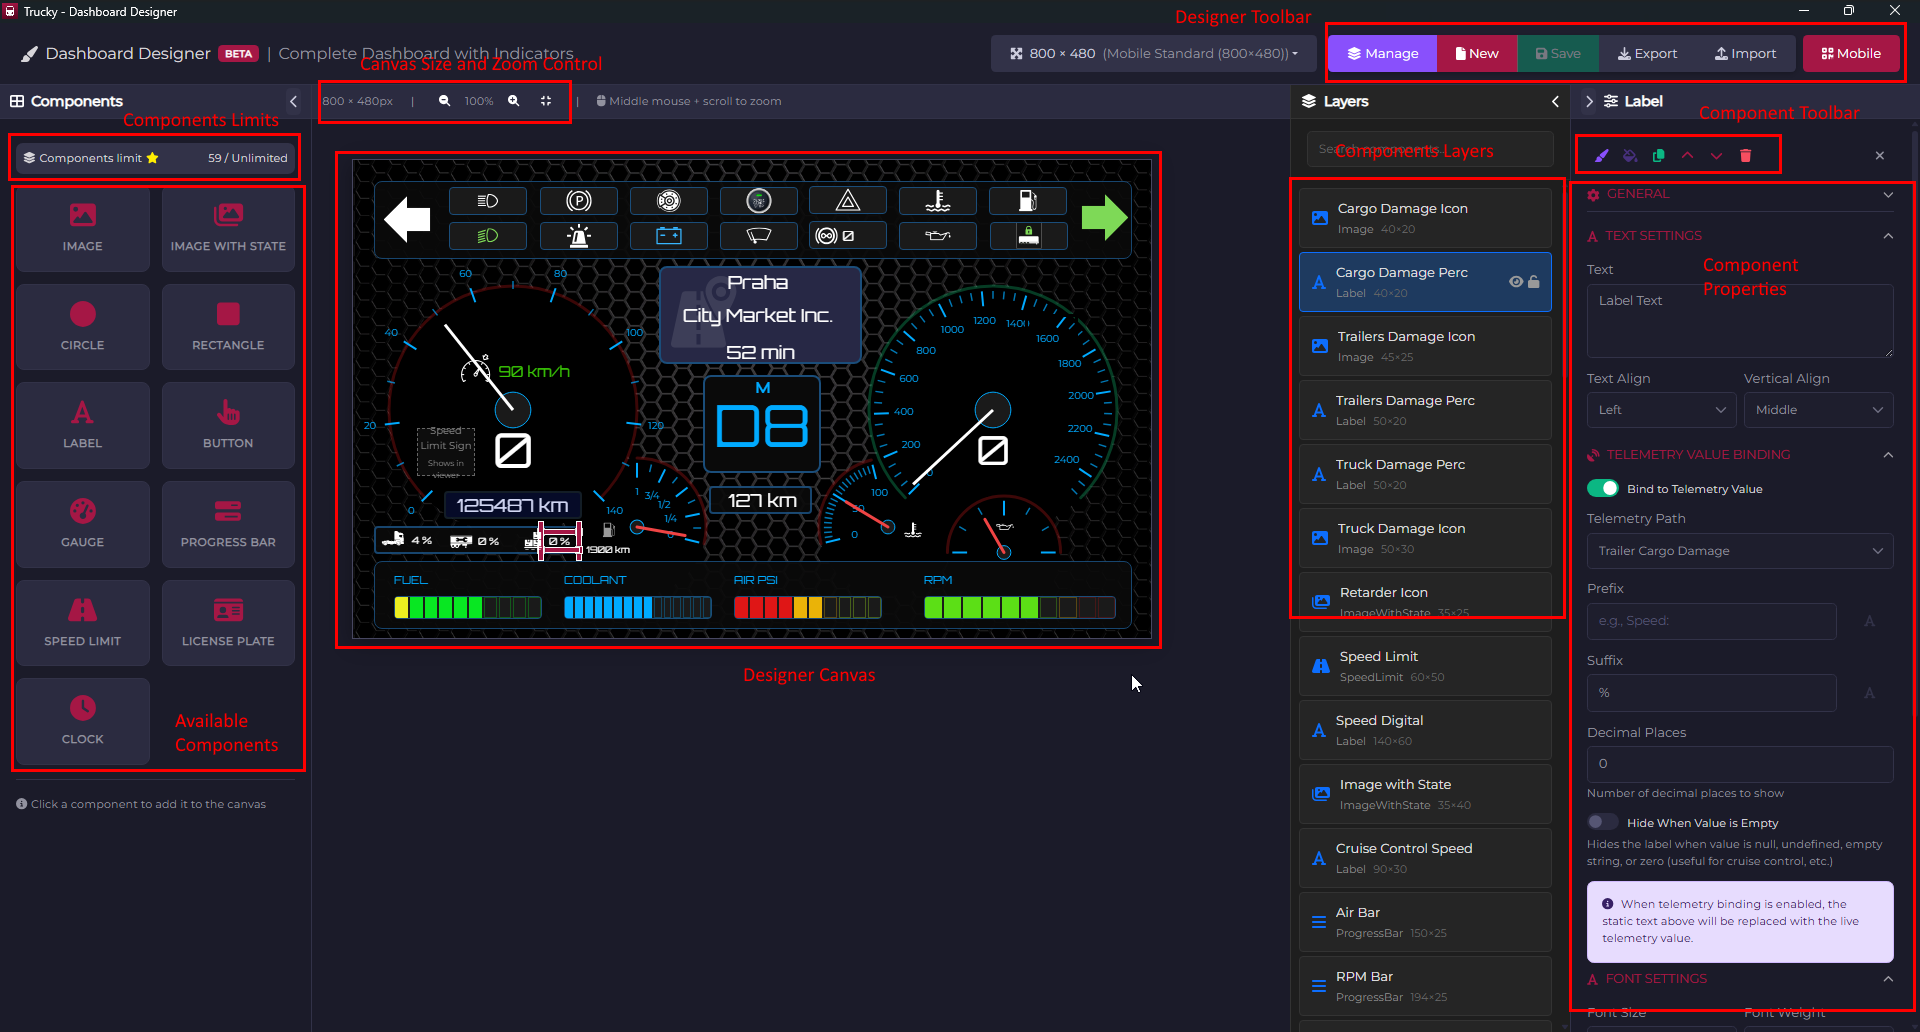
On the left:
- Components Limits
- Available Components
In the center the main Canvas
In the upper bar, the dashboard size and the zoom control, the Designer Toolbart with:
- Manage button: opens the Dashboards Manager where you can find all dashboards, change active dashboard, delete dashboards
- New : starts a new empty Dashboard
- Export : export the current dashboard to a json file
- Import : import a Dashboard json file (must respect your Components Limits)
- Mobile : shows the Mobile dialog to load quickly or configure the Trucky Dashboard Mobile app
On the right:
- Components Layers: a list of all components with a search bar
- When a component is selected, the Component Properties form or the Dashboard Settings when no components are selected
Keyboard and Mouse Controls
Keyboard arrow keys can be used to move components in every direction
Hint: if you want a fine grane movement with arrow keys, adjust the Grid Size in Dashboard Settings to a lower value
DELETE button to delete the component
CONTROL+D to duplicate the component
Zoom in and zoom out: Mouse central wheel + movement ahead or backward
Component Toolbar
In order, from left to right:
- Copy style
- Paste style
- Duplicate component
- Move up in the visibility tree
- Move down in the visibility tree
- Delete component
![]()
The Component Toolbox – Your Building Blocks
Image Component
What it does: Display static images or icons on your dashboard – perfect for logos, truck branding, or decorative elements.
What you can achieve:
- Add your trucking company logo
- Display truck manufacturer badges
- Create custom backgrounds with texture images
- Show warning icons or status indicators
Key Settings:
- Image Source: Upload your own images or choose from Trucky’s built-in gallery (50+ trucking-themed icons!)
- Fit Mode: Choose how your image fits – contain (shows full image), cover (fills space), or fill (stretches to fit)
- Opacity: Make images transparent or semi-transparent for layered effects
- Rotation: Rotate your image to any angle
- Flip: Mirror your image horizontally or vertically
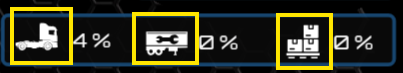
Image with State Component
What it does: Automatically switches between two images based on real-time telemetry data – incredibly powerful for visual feedback!
What you can achieve:
- Show beacon lights turning on/off
- Display cruise control status with different icons
- Indicate trailer connection status
- Show headlights, wipers, or any on/off feature from your truck
Key Settings:
- Image On: The image displayed when the condition is TRUE
- Image Off: The image displayed when the condition is FALSE
- Telemetry Binding: Connect to any boolean telemetry value (lights, brakes, engine status, etc.)
- Invert State: Swap the on/off behavior if needed
Pro Tip: Combine multiple Image with State components to create a realistic dashboard display that reacts to everything happening in your truck!
Label Component
What it does: Display text – from simple titles to live telemetry values. The workhorse of any dashboard!
What you can achieve:
- Show current speed in big, bold numbers
- Display fuel percentage, cargo weight, or any numeric value
- Create section titles and headers
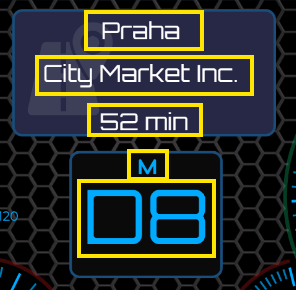
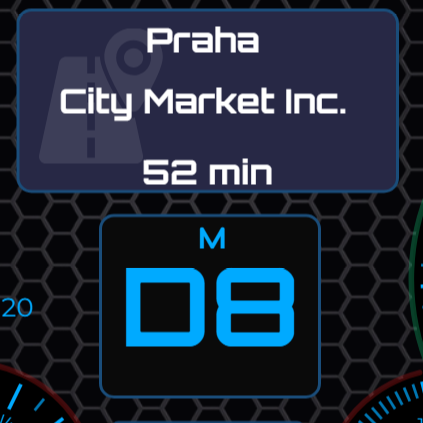
- Show driver name, company name, or custom messages
- Display countdown timers for rest stops
- Show navigation information and destination
Key Settings:
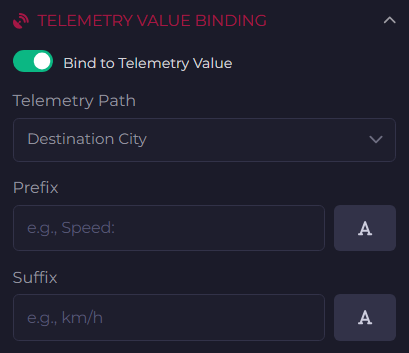
- Text Content:
- Static Text: Type anything you want (e.g., “Speed:”, “Fuel Level”)
- Telemetry Value: Pull live data from your truck (speed, RPM, fuel, damage, etc.)
- Formatted Values: Add units, prefixes, suffixes (e.g., “Speed: {speed} km/h”)
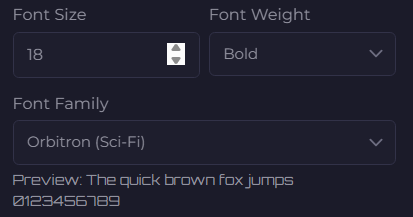
- Font Settings:
- Size: From tiny labels to giant displays
- Family: Choose from multiple professional fonts
- Weight: Light, regular, bold, or extra bold
- Color: Any color you can imagine
- Text Alignment: Left, center, right, or justified
- Text Transform: Uppercase, lowercase, or capitalize
- Shadow: Add depth with customizable text shadows
- Stroke: Outline your text for better visibility
Special Features:
- Number Formatting: Automatic decimal places, thousands separators
- Conditional Colors: Change text color based on value (e.g., red when fuel is low)
- Live Updates: Text updates in real-time as you drive!
Circle Component
What it does: Add perfect circles to your design – simple but incredibly versatile!
What you can achieve:
- Create status indicators (green = good, red = warning)
- Design background elements for gauges
- Build custom traffic lights or warning systems
- Add decorative elements to frame other components
Key Settings:
- Fill Color: Solid color, gradients, or images
- Border: Thickness, color, and style
- Opacity: Create glass-like effects
- Background Effect: Linear or radial gradients for stunning visuals
Rectangle Component
What it does: Add rectangular shapes – the foundation of organized, structured dashboards.
What you can achieve:
- Create panels and sections to group information
- Design progress bar backgrounds
- Build custom frames and containers
- Add colored backgrounds to highlight important data
Key Settings:
- Fill Options: Solid colors, gradients, or background images
- Border: Full control over thickness, color, and corner radius (rounded corners!)
- Corner Radius: Make sharp corners or completely rounded pill shapes
- Rotation: Create diagonal design elements
Button Component
What it does: Add interactive buttons that can trigger actions – bring your dashboard to life!
What you can achieve:
- Take screenshots with one click
- Toggle telemetry recording
- Quick access to Trucky features
- Reset trip statistics
- Change dashboard views
Key Settings:
- Label: The text on your button
- Action Type: Choose what the button does
- Hover Effects: Colors change when you mouse over
- Border & Styling: Make it look exactly how you want
- Icon Support: Add icons alongside text
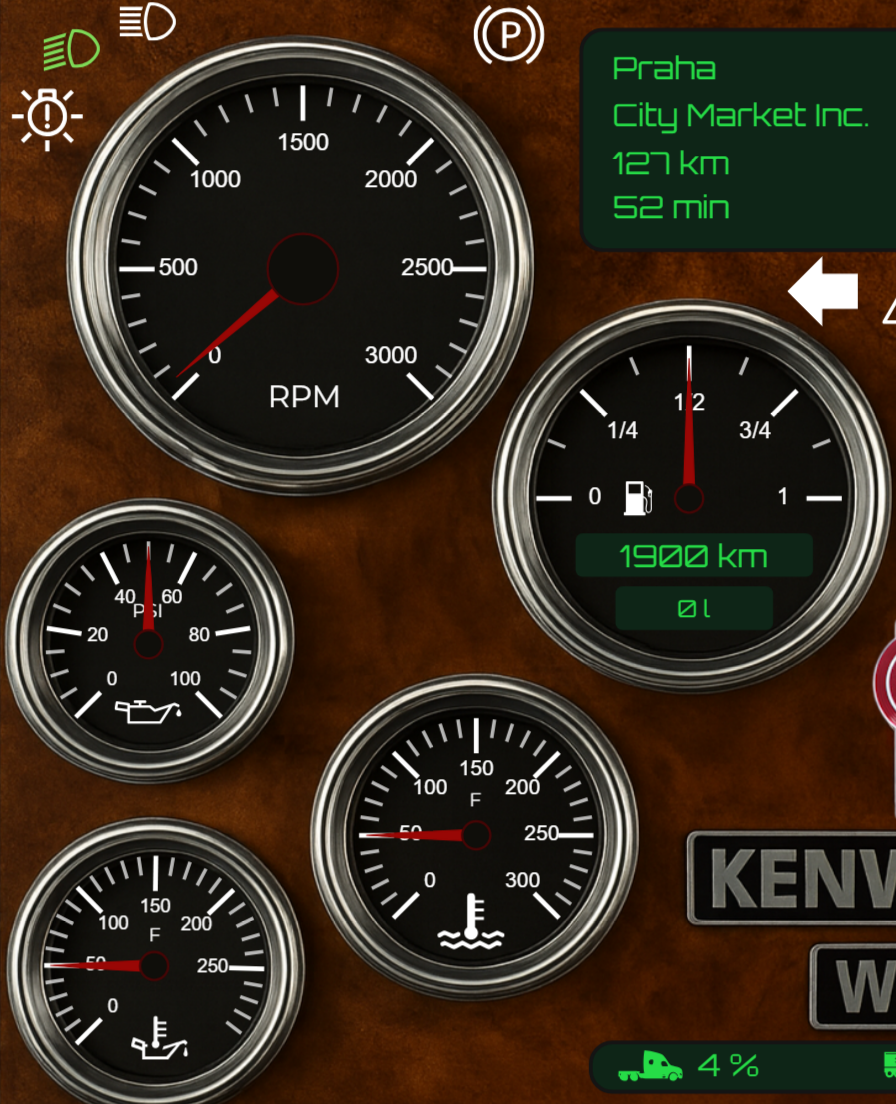
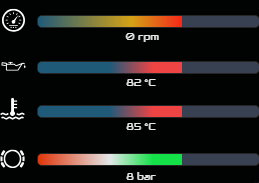
Gauge Component
What it does: Create stunning, realistic gauges just like in a real truck dashboard – the crown jewel of the designer!
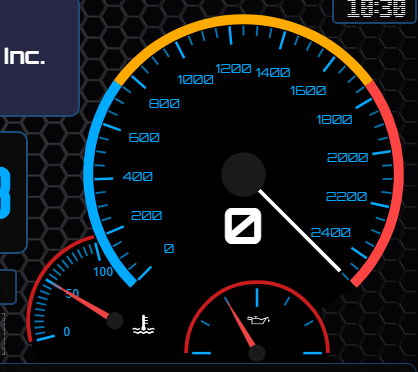
What you can achieve:
- Build a complete speedometer that reacts to your actual speed
- Design a tachometer (RPM gauge) with red-line zones
- Create fuel gauges with E-F markers
- Monitor air pressure, oil temperature, or any numeric value
- Design custom gauges with any range and appearance
Key Settings:
Gauge Type:
- Half Gauge: Classic semicircle speedometer style
- Three-Quarter: Extended range for more detail
- Quarter Gauge: Compact corner-style gauge
- Full Circle: Complete 360° gauge
- Custom Angles: Set your own start and end points!
Value Configuration:
- Min/Max Values: Set the gauge range (e.g., 0-160 km/h)
- Current Value: Connect to live telemetry or set manually
- Value Binding: Link to speed, RPM, fuel, damage percentage, or any numeric telemetry
Visual Customization:
- Gauge Arc Color: The background arc color
- Tick Marks: Major and minor interval marks
- Tick Position: Inside, outside, or centered on the arc
- Numbers: Show/hide value labels, customize formatting
- Number Position: Place numbers inside or outside the arc
Needle Settings:
- Needle Style: Classic pointer, modern arrow, or custom design
- Needle Color: Match your theme
- Needle Length: Adjust how far it extends
- Center Hub: Customizable center point with color and size
- Needle Shadow: Add depth and realism
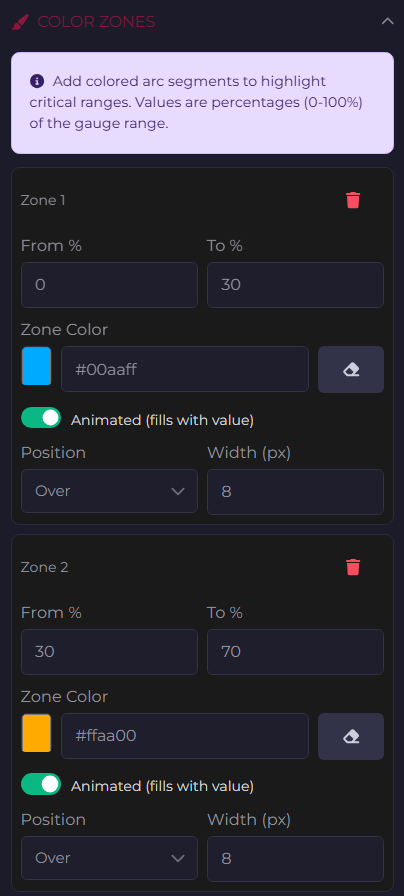
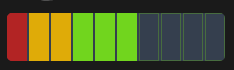
Color Zones (Game Changer! 🎯):
- Define colored ranges (e.g., green 0-80%, yellow 80-95%, red 95-100%)
- Animated Zones: Make danger zones grow with the needle
- Position Control: Display zones inside, outside, or over the gauge arc
- Custom Width: Make zones subtle or prominent
Advanced Features:
- Background Image: Use a real gauge image as background
- Elliptical Gauges: Create oval-shaped gauges, not just circles
- Rotation & Flipping: Orient your gauge any way you want
- Opacity Control: Layer gauges for complex displays
Pro Tips:
- Use animated color zones for critical values (RPM redline, low fuel warning)
- Combine multiple gauges with different sizes for a realistic dashboard cluster
- Set elliptical gauges for a 3D perspective effect
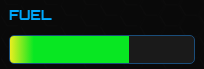
Progress Bar Component
What it does: Display values as horizontal or vertical bars – simple, clean, and effective!
What you can achieve:
- Show fuel level as a filling bar
- Display cargo damage as a warning bar
- Monitor truck damage percentage
- Track job completion progress
- Create health/status bars for any value
Key Settings:
- Orientation: Horizontal or vertical
- Direction: Fill from left-to-right, right-to-left, bottom-to-top, or top-to-bottom
- Min/Max Values: Define your range
- Value Source: Connect to telemetry or set fixed values
- Bar Color: Solid or gradient fills
- Background Color: The empty part of the bar
- Border & Styling: Make it match your design
- Rounded Corners: Smooth, modern look
- Show Label: Display the numeric value on the bar
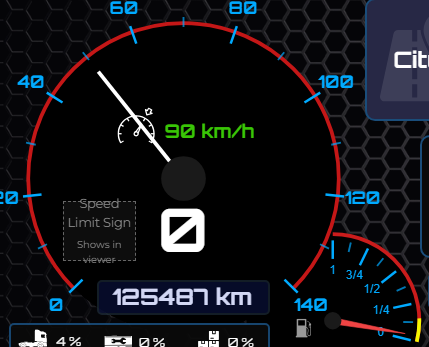
Speed Limit Component
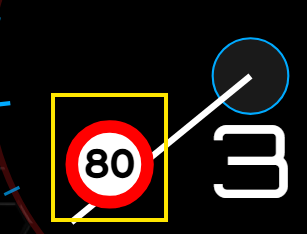
What it does: Displays the current speed limit sign – automatically matches the game’s speed limit!
What you can achieve:
- Show realistic speed limit signs
- Stay aware of speed restrictions
- Create immersive, regulation-compliant displays
Key Settings:
- Style: European, US, or custom design
- Size: From small corner indicators to large displays
- Colors: Customize to match your dashboard theme
License Plate Component
What it does: Displays your truck’s license plate – add authenticity to your dashboard!
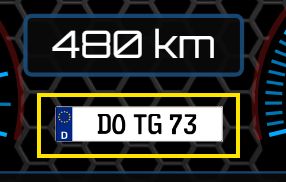
What you can achieve:
- Show your custom truck plate
- Add regional flavors (EU, US styles)
- Personal branding element
Key Settings:
- Plate Style: Different regional formats
- Text: Automatic from game or custom
- Colors: Match real license plate designs
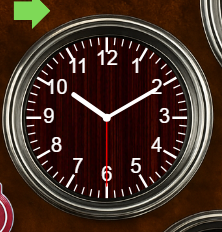
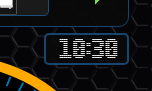
Clock Component
What it does: Display the time in style – choose between digital precision or classic analog elegance!
What you can achieve:
- Show in-game time or real-world time
- Create classic analog clock faces
- Design modern digital time displays
- Add world clocks for different time zones
Key Settings:
Digital Style:
- Time Format: 12-hour or 24-hour
- Font & Color: Full customization
- Show Seconds: Include/exclude seconds
- Date Display: Optionally show the date too
Analog Style:
- Clock Face: Upload custom clock backgrounds
- Hand Colors: Separate colors for hour, minute, second hands
- Hand Styles: Classic, modern, or minimal
- Center Hub: Customize the center point
- Tick Marks: Add hour and minute markers
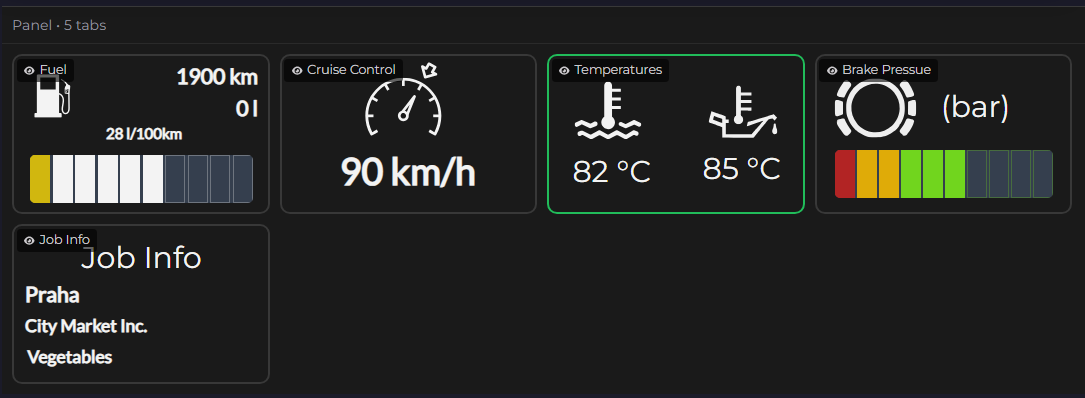
Panel Component (Advanced) 🚀
What it does: Create multi-tabbed containers – build complex, organized dashboards with multiple views!
What you can achieve:
- Organize related information into tabs
- Create dashboard sections that users can switch between
- Build professional, app-like interfaces
- Group components logically
Key Settings:
- Tab Configuration: Add, remove, rename tabs
- Tab Content: Each tab is its own canvas
- Tab Styling: Customize colors, fonts, active states
- Panel Background: Unique background per tab
Pro Tip: Use panels to create a “multi-page” dashboard without leaving the screen!
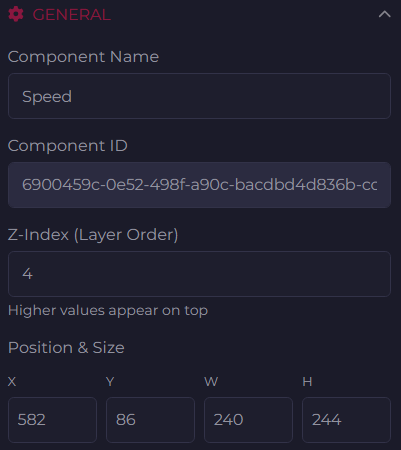
Universal Settings – Available for All Components
Position & Size
What you can control:
- X, Y Position: Exact pixel placement
- Width, Height: Precise sizing
- Lock Aspect Ratio: Maintain proportions when resizing
- Rotation: Rotate to any angle (0-360°)
- Flip: Mirror horizontally or vertically
Pro Tip: Use the grid and snap-to-grid features for perfect alignment!
Background & Colors
Every component can have:
- Solid Colors: Choose from millions of colors
- Linear Gradients: Smooth color transitions (top-to-bottom, left-to-right, diagonal)
- Radial Gradients: Circular color spreads from center
- Background Images: Layer images behind your components
- Opacity Control: Make elements transparent or opaque
Borders
Add polish with customizable borders:
- Border Width: Thin lines to thick frames
- Border Color: Match any color scheme
- Border Radius: Create rounded corners (great for modern designs!)
- Border Style: Solid, dashed, or dotted
Telemetry Binding – The Power Feature! ⚡
This is where things get REALLY exciting! Connect components to live truck data:
Available Data Sources:
- Truck Telemetry: Speed, RPM, fuel, odometer, damage, engine temperature, air pressure, and 100+ more values
- Navigation: Destination, distance, ETA, route planning
- Job Information: Cargo weight, cargo damage, delivery deadline
- Truck Status: Lights, cruise control, parking brake, wipers, retarder, all switches
- Game Info: Time, weather, location
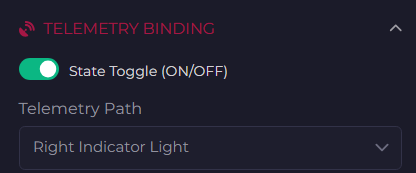
How It Works:
- Select a component (e.g., a Label)
- Open “Telemetry Binding” section in properties
- Enable binding
- Choose your data source from the dropdown (organized by category!)
- Set formatting options (units, decimal places, etc.)
- Watch your dashboard come alive!
Example Uses:
- Label showing live speed:
{truck.speed} km/h - Gauge tracking RPM: Bind min/max/current to engine data
- Progress bar for fuel: Connect to fuel percentage
- Image switching for lights: Bind to truck.lights.enabled
Conditional Formatting
Make components react to data:
- Color Changes: Turn labels red when fuel is low, green when full
- Visibility Rules: Show warnings only when damage exceeds a threshold
- Animated Responses: Flash or highlight based on conditions
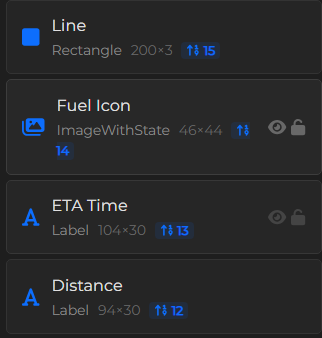
Working with Layers
Layer Management Panel
Keep your dashboard organized with the Layers panel:
Features:
- Z-Index Control: Which components appear on top
- Visibility Toggle: Show/hide components (eye icon)
- Lock Components: Prevent accidental changes (lock icon)
- Quick Selection: Click to select components
- Search: Find components by name or type
Pro Tip: Name your components descriptively (“Main Speedometer”, “Fuel Gauge”, “Company Logo”) to stay organized!
Organizing Your Design
- Bring to Front / Send to Back: Control layering
- Bring Forward / Send Backward: Fine-tune layer order
- Group Similar Items: Keep related components close in the layer stack
Advanced Techniques
Copy & Paste Styles
Created the perfect look? Share it across components:
- Select a component with your desired style
- Click “Copy Style”
- Select another component
- Click “Paste Style”
All colors, fonts, borders, and effects copy over instantly!
Grid & Snapping
Perfect alignment made easy:
- Show Grid: Visual guide for placement
- Snap to Grid: Components automatically align
- Grid Size: Adjust for fine or coarse control
- Toggle On/Off: Work freely or with precision
Zoom Controls
See the big picture or fine details:
- Zoom In/Out: 25% to 400%
- Fit to Screen: See your entire dashboard
- Actual Size: Preview at real dimensions
Image Gallery
The Dashboard Designer comes with more than 509 high-quality SVG already in multi-state colors to be used with the Image with State component
How to use the Dashboard on local computer
There are two ways:
- Using the Dashboard Viewer present directly in the Trucky Client, from the Trucky Tray icon > Dashboard Viewer
- Using the browser visiting:
http://localhost:25556/viewer
How to use the Dashboard on your mobile Device
First, prepare your PC and network connection: the computer and the mobile device must be on the same network and must be capable of talking each other.
First, download the app Trucky Dashboard on your mobile device


The QR Code Dialog shows a QR Code that can be shoot directly from the Trucky Dashboard mobile app that will configure automatically the app to connect to the computer with the preferred IP address.
All your IP addresses are shown there in the dropdown list so you can choose the correct IP based on your network settings.
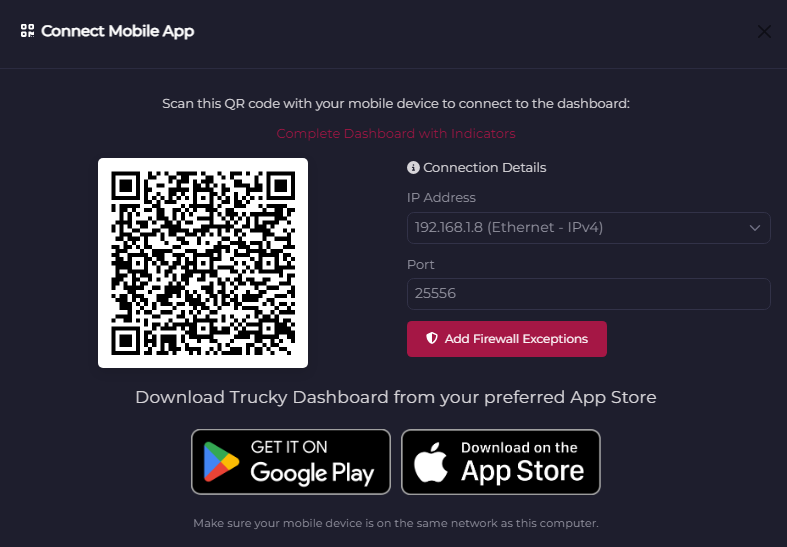
Hint: if you have issues configuring your computer to be able to talk with the mobile app, use the “Add Firewall Exceptions” button to add Firewall rules to your system allowing Trucky to be contacted from the local and external network.
How to use the Dashboard on a remote computer
You can visit the Dashboard Viewer also from a remote computer using simply your browser at the address
http://<IP ADDRESS WHERE TRUCKY IS INSTALLED>:25556/viewer
Dashboard Management
Saving Your Masterpiece
How to Save:
- Click the “Save” button in the top toolbar (or press Ctrl+S)
- Your dashboard is instantly saved with all components, settings, and configurations
- You’ll see a confirmation message – your work is safe!
What Gets Saved:
- All components and their positions
- Every property and setting you’ve configured
- Telemetry bindings and data sources
- Layer order and visibility states
- Dashboard canvas size and settings
Pro Tip: Make it a habit to save frequently, especially before making major changes. While auto-save has your back, manual saves give you peace of mind!
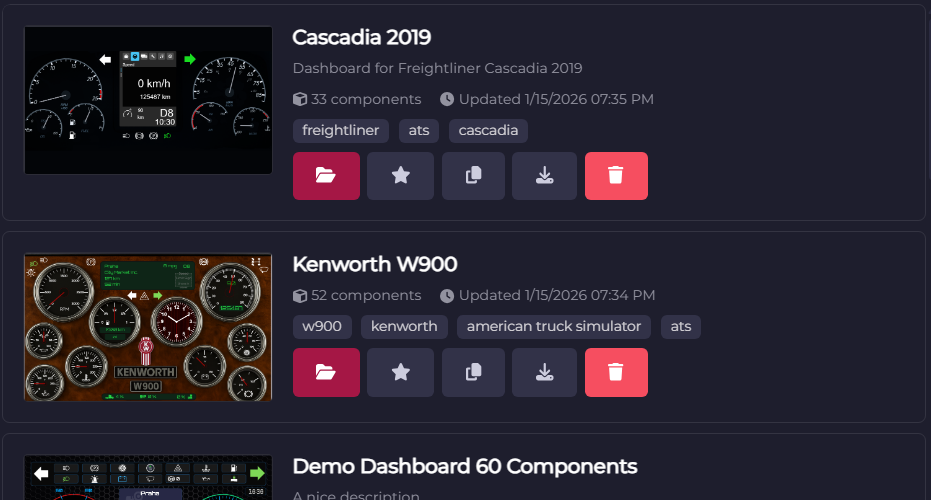
Dashboard Manager – Your Dashboard Hub
The Dashboard Manager is your central command for organizing all your creations. Think of it as your dashboard library!
Opening the Dashboard Manager:
- Click “Manage” button in the top toolbar
- Browse all your saved dashboards in one place
What You Can Do:
📋 Browse Dashboards:
- See thumbnail previews of each dashboard
- View dashboard names and creation dates
- Quick search to find specific designs
- Sort by name, date, or recently modified
🎯 Set Active Dashboard:
- Click “Activate” on any dashboard to make it your current display
- The active dashboard is what appears in the Viewer and Mobile app
- Perfect for switching between different layouts for different jobs or moods!
📂 Load for Editing:
- Click “Edit” to open a dashboard in the Designer
- Make changes and improvements anytime
- Your original is preserved until you save changes
📋 Duplicate Dashboards:
- Found a design you love? Duplicate it!
- Click “Duplicate” to create an instant copy
- Perfect for creating variations (day theme, night theme, minimal version, etc.)
- The copy gets a new name automatically – rename it to whatever you want
🗑️ Delete Dashboards:
- Click “Delete” to remove dashboards you no longer need
- You’ll get a confirmation prompt – no accidental deletions!
- Free up space and keep your library organized
Pro Tip: Create a “base template” dashboard with your favorite styling, then duplicate it whenever you start a new design. Instant consistency!
Export & Import – Share Your Creativity
Take your dashboards anywhere or share them with friends!
Exporting a Dashboard:
- Click “Export” in the top toolbar
- Your dashboard is saved as a JSON file to your computer
- Choose where to save it – perfect for:
- Backing up your favorite designs
- Sharing with friends or the community
- Moving to another computer
- Version control – save different iterations
What’s Included in Export:
- Complete dashboard structure
- All components and settings
- Embedded images (base64 encoded)
- Telemetry bindings and configurations
- Everything needed to recreate your exact design!
Important Notes:
- ⚠️ Component Limits Apply: If you import a dashboard with 30 components but you’re on the Free tier (5 components max), the import will be rejected
- ✅ Images Preserved: All custom images come through perfectly
- 🎨 Ready to Use: Imported dashboards work immediately – activate and go!
- 🔧 Fully Editable: Edit imported dashboards just like your own creations
Pro Tip: Before importing complex dashboards from others, check the component count to ensure it fits within your subscription tier!
Publishing & Sharing to the Community
Share your amazing designs with thousands of Trucky users worldwide! The community gallery is where creativity meets collaboration.
Preparing Your Dashboard for Publishing
Before you publish, make your dashboard shine:
- Test Everything:
- Load it in the viewer while in-game
- Verify all telemetry bindings work correctly
- Check readability and layout at actual size
- Polish the Details:
- Give components descriptive names
- Remove any test or hidden components
- Ensure sizing works well on different screen resolutions
- Optimize Performance:
- Keep component count reasonable
- Use appropriately sized images
- Remove unused background images
Automatic Capture (Recommended):
- In the Designer, arrange at 100% zoom
- In the Properties Panel (when no component is selected), scroll to Dashboard Settings
- Find the “Preview Image” section
- Click “Capture Canvas Screenshot”
- ✨ Boom! Perfect preview captured automatically
What This Does:
- Takes a high-quality screenshot of your entire canvas
- Captures exactly what you see in the designer
- Automatically sized and formatted for the gallery
- Shows your dashboard in its full glory!
Manual Upload Option:
- Already have a great screenshot? Click “Select Image”
- Upload any image file (PNG, JPG, SVG)
- Crop or adjust as needed
Publishing Your Dashboard
Ready to share? Let’s get your dashboard into the community gallery!
Step-by-Step Publishing:
- Open Dashboard Settings:
- Click anywhere on the empty canvas (deselect all components)
- The Properties Panel switches to Dashboard Settings
- Fill in the Details:Dashboard Name:
- Give it a clear, descriptive name
- Make it searchable – think about what others might look for
Description (Optional but Recommended):
- Explain what makes your dashboard special
- Mention key features or telemetry values displayed
- Add usage tips or recommendations
- Share your inspiration or design philosophy
Example: “A clean, modern speedometer with RPM gauge and fuel indicator. Perfect for minimalists who want essential info without clutter. Optimized for 1920×1080 displays.”
- Set Preview Image:
- Use the captured screenshot or upload your own
- This is what appears in the community gallery
- Click “Publish Dashboard”:
- Your dashboard uploads to the Trucky community
- Processing takes just a few seconds
- You’ll see a success confirmation!
After Publishing:
- ✅ Your dashboard appears in the community gallery
- 🌟 Other users can find it, preview it, and import it
- 📊 You can see how many downloads/uses it gets
- 🔄 You can update it anytime by re-publishing
Updating a Published Dashboard:
- Make changes in the Designer
- Save your updates
- Update the version number!
- Click “Publish Dashboard” again
- The published version updates automatically!
Importing Community Dashboards
Why build from scratch when you can stand on the shoulders of giants? The Trucky community has created thousands of stunning dashboards ready for you to use!
Browsing the Community Gallery
Accessing the Gallery:
- From the Dashboard Designer from the Designer toolbar or navigate https://hub.truckyapp.com/dashboards
- Click the “Community” or “Browse Gallery” tab
- Instant access to thousands of community creations!
One-Click Import
Importing is incredibly simple:
- Find Your Dashboard: Browse or search until you find the perfect one
- Click “Import”: One button does it all!
- Automatic Download: The dashboard downloads and installs instantly
- Ready to Use: It appears in your Dashboard Manager immediately!
What Happens During Import:
- ✨ Complete dashboard structure is downloaded
- 🎨 All images and assets are included
- 🔧 All settings and telemetry bindings are preserved
- 📋 Dashboard is added to your library
- ✅ Ready to activate or edit immediately!
Component Limit Protection:
- If a dashboard exceeds your tier limit, you’ll get a friendly warning
- The system won’t let you import incompatible dashboards
- Consider upgrading your tier or choose a simpler dashboard